

Learn from the Differences, Not the Similarities
It’s common to compare Excel and Power BI—and understandably so. Both are powerful tools for analysis and reporting. Both serve analytical minds that are comfortable with formulas. And yes, many functions exist in both tools.
But these similarities can also be misleading. While they provide a soft landing for Excel users entering Power BI, they also mask qualities that help the advancing developer progress in Power BI—especially when learning DAX.
The “Simplicity Layer” of DAX
There’s a layer of simplicity in Power BI that mimics Excel’s expression logic. It’s intentional. It helps new users, especially those with an Excel background, gain early confidence. Functions like SUM() and AVERAGE() feel familiar, and visuals update as expected with just a few clicks. You get quick wins.
But that simplicity also hides important model functions in DAX that drive evaluation and results behind the scenes.
Let’s look at a simple DAX measure:
Sales Measure = SUM(SalesTable[Amount])It works. You drop it into a visual, and numbers appear. It feels like Excel—you sum a column and see the total in a table. Simple.

But what you’re not seeing is how DAX interprets this over the model, and not the visual.
The equivalent, more explicit DAX would look like this:
Sales Measure = SUMX(SalesTable, SalesTable[Amount])This explicit version uses SUMX, an iterator function. It steps through each row of SalesTable, evaluating the expression SalesTable[Amount] one row at a time. The last and final step is to sum the results of each evaluated row. That’s the real work being done over the model rather than a simple sum over the visual itself.
Why is the more explicit SUMX function important to know? Because it provides a helpful option in avoiding a costly calculated column in our table.
Avoid adding costly columns
If our sales table provides only a quantity and unit price column, then we are forced to multiply the two together, then finally summing the result.
Sound familiar? instead of adding a costly calculated column, we can now leverage our knowledge of SUMX to evaluate each row of sales in our measure. All we have to do is use SUMX and multiply each quantity and unit price one row at a time:
Sales Measure Two Columns =
SUMX(SalesTable,
SalesTable[Quantity]*SalesTable[UnitPrice]
)
Learning SUMX is our first step in moving away from simple visual evaluation, toward a model driven mindset. This is often where the advancing BI developer reaches a turning point: realizing that calculated columns aren’t best practice, and that clicking visuals doesn’t equate to understanding the extent of using filters over the model. This is where we start exposing how DAX really works in the background.
Hold on, this is where real learning begins!
So why does Power BI let you write the simple version?
Because it hides complexity to make early development feel smooth. But if you want real control—especially as your models grow more complex—you must learn to write DAX with the model in mind.

Filtering with CALCULATE
Let’s look at a measure using CALCULATE:
Red Sales =
CALCULATE(SUM(SalesTable[Amount]), ProductTable[Color] = "Red"
)
This appears simple enough—you want to filter and show only red product sales. But when you add this measure to a visual grouped by color, you notice something strange: every color row shows the red sales value.
Why?
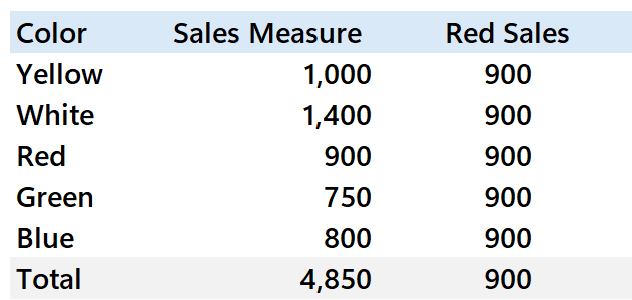
Because your filter isn’t restricting the result to the filter coming from the visual. To understand this result, we must first expose the full underlying model logic in DAX:
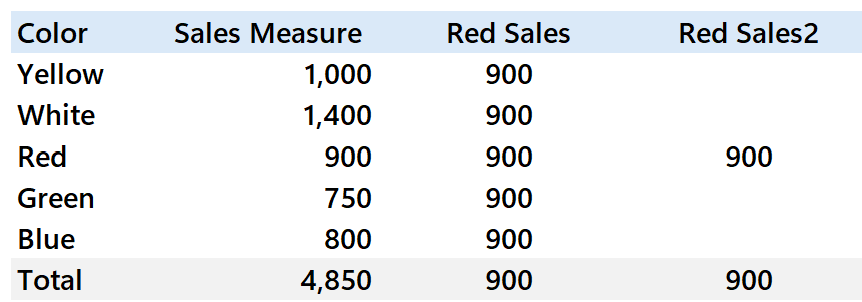
Red Sales =
CALCULATE(
    SUM(SalesTable[Amount]),
    FILTER(ALL(ProductTable[Color]), ProductTable[Color] = "Red")
)
Here, FILTER and ALL are both table functions that interact with the model. ALL(ProductTable[Color]) replaces the report visual filter (say green), letting FILTER evaluate every possible color option in the product table. This allows DAX to always find and return our valid product condition Color = Red—even when the report visual is currently evaluating for a different color like green products.
However, if we remove the ALL-table function, then our DAX result changes. Instead of ignoring the filter on green coming from the visual, it now remains and serves as an initial filter over our FILTER(Product[Color]) table expression.
When we evaluate this table with a valid filter for green, and search for red products, we come up empty handed. There are no valid product rows to filter, and thus there are no valid sales to return to the visual.
In this case, we only see sales when we land on the report filter of red, which survives our FILTER expression of Color = Red:
Red Sales2 =
CALCULATE(
    SUM(SalesTable[Amount]),
    FILTER(ProductTable, ProductTable[Color] = "Red")
)
The Lesson: DAX Is a Model-Based Language
The more you work in Power BI, the more you realize that DAX is not like Excel. Yes, it may look familiar at first—but under the surface, it evaluates against a data model using context-based logic.
Your job as a Power BI developer is to learn the model side of DAX. That means understanding:
- Filter context: what filters are active when your measure runs?
- Row context: when do you need to use DAX functions that first evaluate row-by-row?
- Context transition: how to convert row context into filter context?
- CALCULATE: how to further alter and add to existing filter context as a developer.
Even if you don’t see CALCULATE in a simple expression, it’s likely happening behind the scenes. Learning to write with explicit DAX functions helps you debug and extend your logic later.
Advice for Excel Users in Power BI
I wish Power BI had a toggle to expose the full model logic behind every simple measure. Until that exists, my advice is:
- Learn model-based DAX early. It will slow you down at first—but you’ll gain real control.
- Add comments in your measures to remind yourself of filter assumptions (e.g., “this is filtered to red products only”).
- Use resources that teach context, not just syntax.
If you’re coming from Excel, resist the temptation to stay in the simplicity layer. It may feel good at first—but it hides the truth.
Learning Resources I Recommend
To deepen your DAX skills, especially the model side of DAX, focus on foundational concepts like:
- Evaluation context: filter context, row context, context transition
- Iterators like SUMX, AVERAGEX, FILTER
- Performance tuning: bad DAX slows reports down
Beginner-friendly:
📘 Supercharge Power BI by Matt Allington
Intermediate and advanced:
📘 SQLBI.com has incredible visual resources:
Watch-and-learn:
- Replay conference sessions that break down DAX visually and conceptually
- My YouTube channel includes playlists on evaluation order and model logic
- If you are interested in hands on guided training, check out our course Learn DAX DOJO.
A Note on AI in 2025
I’m a fan of AI tools like ChatGPT—they’ve helped me accelerate learning in areas like SQL and Python. I use them like a study partner, often cross-referencing with trusted books or documentation.
However, for DAX, AI still struggles.
Due to:
- The relative youth of DAX
- The automatic simplification of expressions in Power BI
- Heavy dependence on model context and performance
…it’s easy for AI tools to give incorrect or misleading answers. Use them with caution and always verify their logic with trusted learning sources.
Final Thoughts
The simplicity layer of DAX is a great on-ramp—but it won’t get you far on its own.
To truly master Power BI, you must go beyond what’s visible. Learn to write DAX with the data model in mind. Understand context. Use iterators and table functions. And never stop digging into the “why” behind a measure’s result.
You don’t need to know everything about DAX—but you do need to understand that DAX evaluates over the model, not the visual.
That insight alone can change how you approach reporting—and potentially change your career as an Excel professional stepping into the world of Power BI.
Thank you for taking the time to read the blog. If you’d like to learn more about our community #SML Crew, check out our website.
If you would like to learn more about leveling up in DAX, please connect with me on LinkedIn @markwaltercpa.