
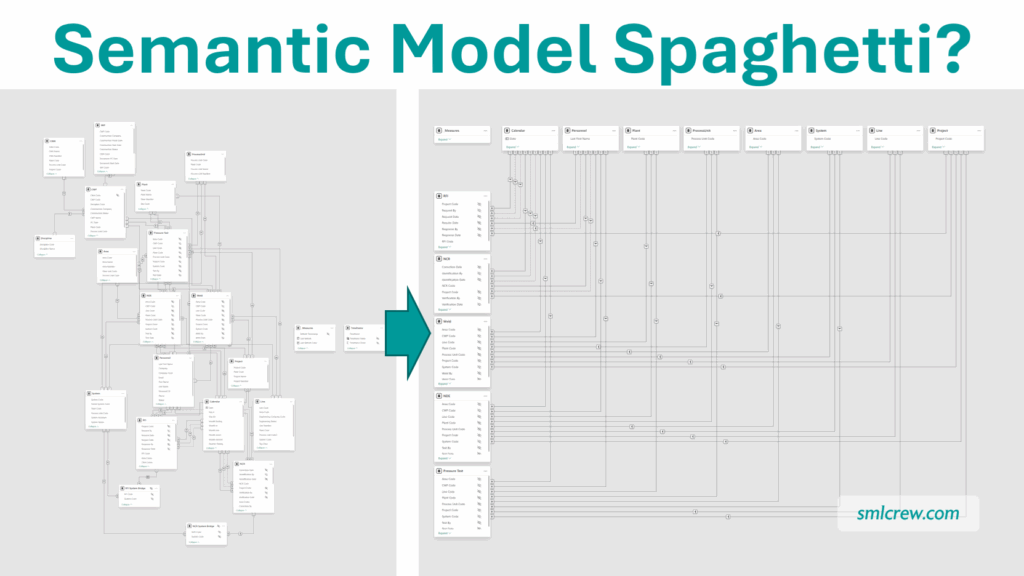
Does Your Power BI Semantic Model look like this?
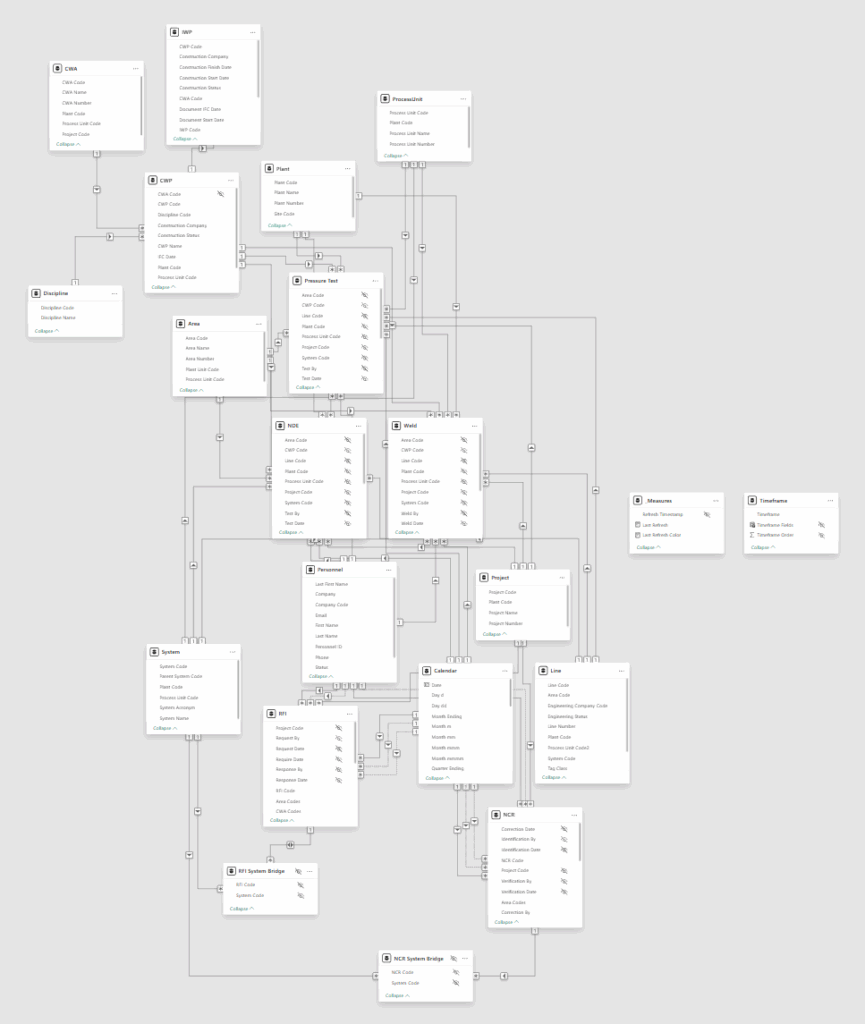
Power BI’s default Semantic Model layout is a little disorganized, to put it mildly. The tables are strewn in a haphazard manner, and the relationship lines are hard to follow. It takes some time to identify which tables are Facts or Dimensions, and even longer to understand the model enough to identify potential issues when troubleshooting.
What if your model could look like this instead?
It’s actually quite simple to do, and helps you to understand the bigger picture, and quickly verify the cardinality, and filter direction of each relationship follow the Star Schema.
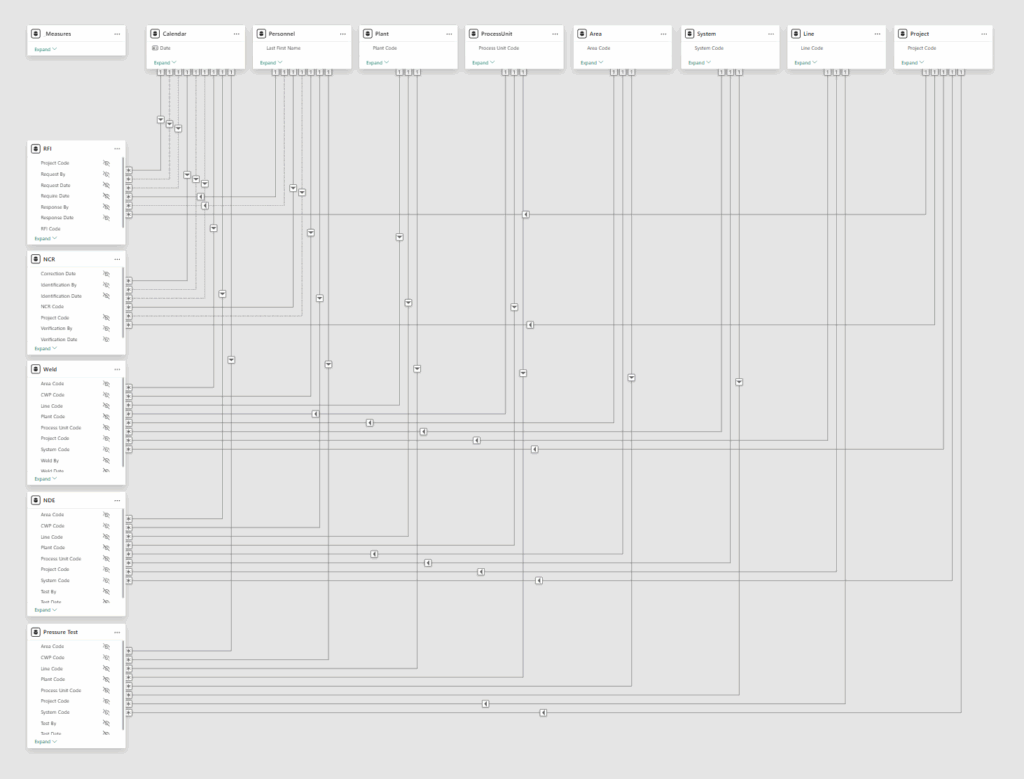
Basic Bus Layout
There are three main steps:
- Drag all your Dimension tables to the top edge, and line them up with some space in between.
- Drag all your Fact tables to the left edge, and line them up with some space in between.
- Move all your Disconnected tables (Parameter tables, etc) off to the right, and arrange as you please. I like to put the Measure Table (if one exists) in the top left, but that is entirely optional.
That’s it! You’ve turned your spaghetti into lasagna (yum!). Now you can see which Facts use which Dimensions, just like in a Bus Matrix. If you’re inheriting a model, pause here and see how different tables are connected (don’t change anything yet though). It should be much easier than before.
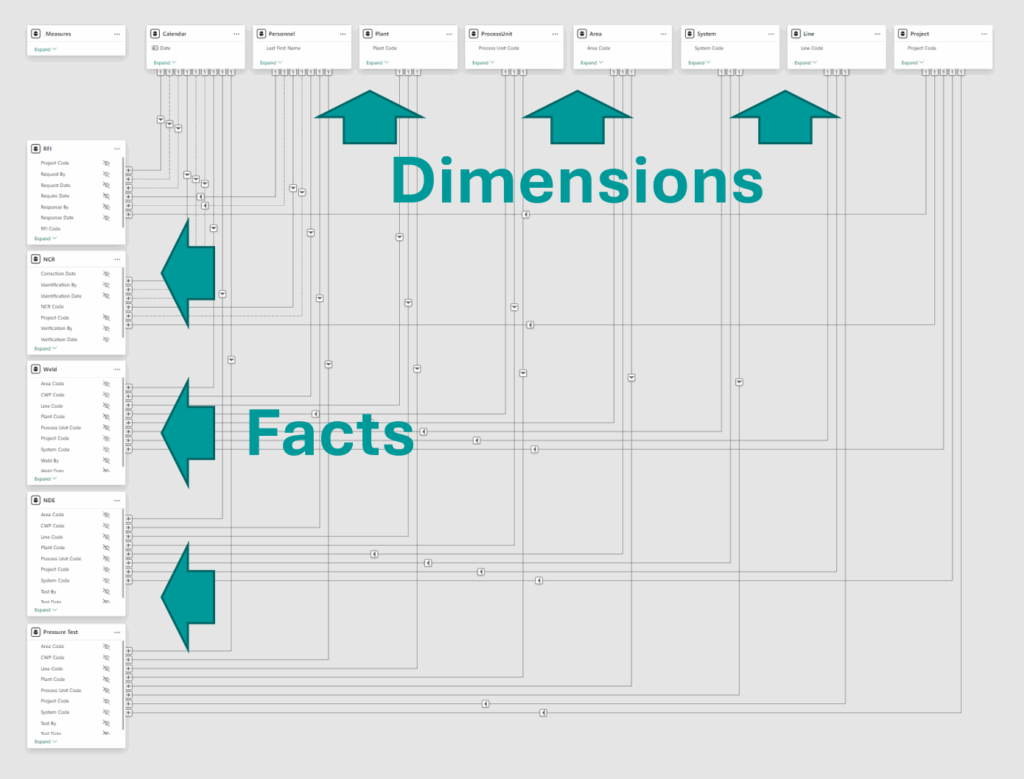
Star Schema
The next step is to verify your model is in a Star Schema:
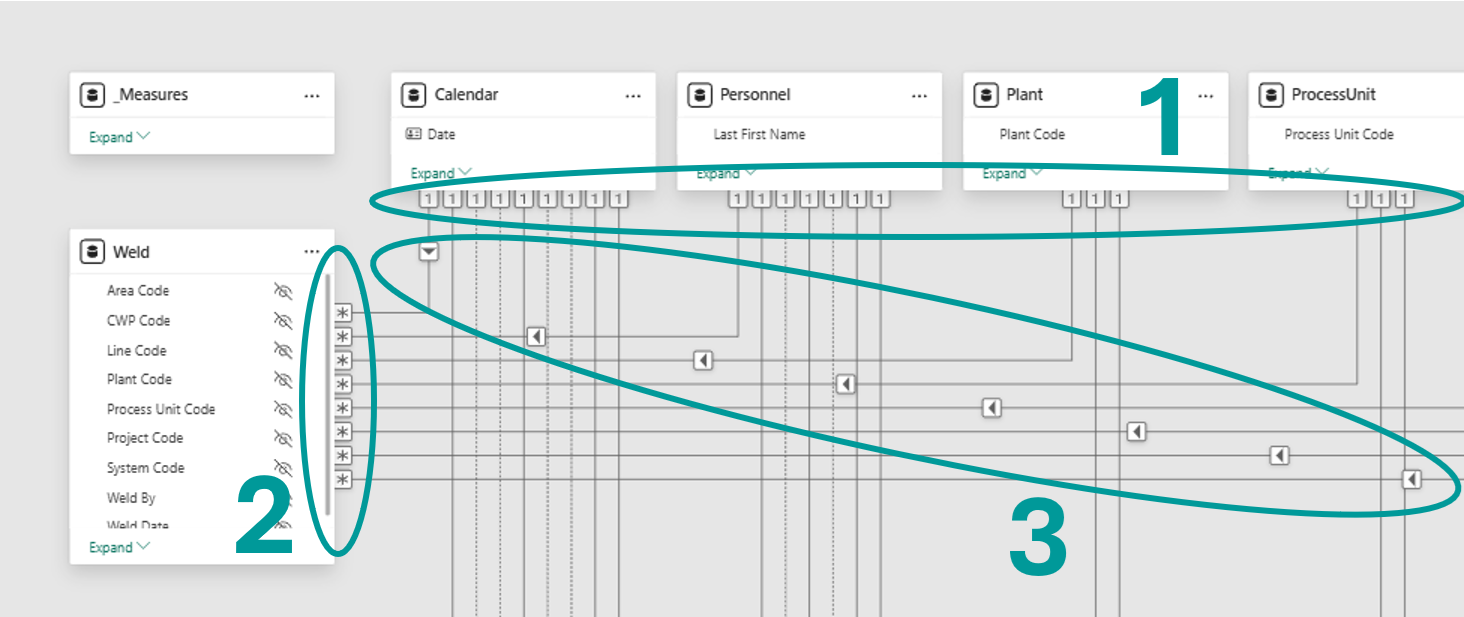
- Check that every relationship line coming out of your Dimension tables along the top are labelled with 1 (i.e. every value in the connecting column is unique).
- Check that every relationship line coming out of your Fact tables along the left are labelled with * (i.e. values in the connecting column are not required to be unique).
- Check that the filter direction arrow on every line is only pointed down or to the left.
If you’re inheriting a model, this quick check may identify a lot of issues. Maybe some tables you thought were Facts are Dimensions, or vice versa. Maybe the model only works because bi-directional filters are masking other issues. Be cautious with any tweaks you decide to make, and check your Canvas view often, as modeling changes will likely cause some broken visuals and DAX errors. This is usually the messiest part of the process.
Hide Foreign Keys
A best practice for Star Schema Semantic Models is to hide foreign keys in Fact tables. The reason is that a developer / user, by default, can see the columns from both sides of a relationship in the model. When building visuals, it is always preferable to choose the column from the Dimension table, as it enables cross-analysis between two or more Fact tables via a common Dimension table, and it is also more performant.
This is really easy to do with the Bus Layout:
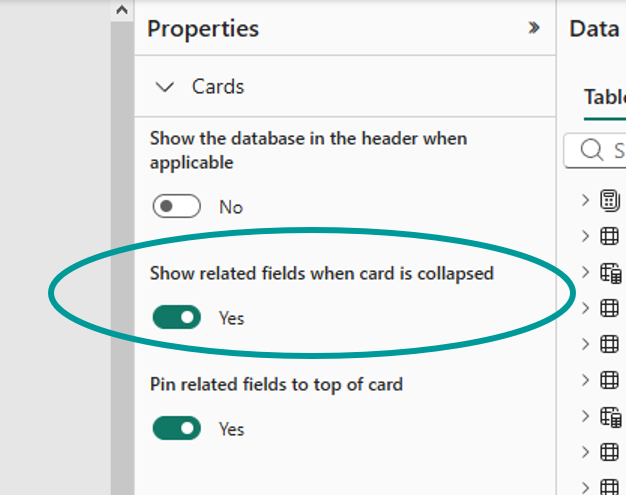
- Click on any blank part of the Model view. You should see the property “Show related fields when card is collapsed”. Select Yes.
- Collapse all of your Fact tables. If you have a proper Star Schema, the only column headers showing are related to a Dimension. Hide all of these.
Advanced Scenarios
For the advanced modelers out there using Bridge Tables, or if you have a very good reason for a Snowflake Schema (hey, no judgement here!), check out my original blog post, which shows how the Bus Layout can handle the added complexity.
In case you’re interested, I also go through a few different ways to arrange your Semantic Model, and the twisty path I took in developing the Bus Layout. Take a look!